


Let us first understand the importance of Data visualization in Business and Data analytics. Data visualization allows data analysts to converse with their end-users. The outcome of data analysis is not immediately comprehensible to the people who do not directly deal with data. Data visualization bridges that gap and makes people understand the possibility of data analysis. Tableau Tutorial helps you to know about Tableau products and benefits in detail.
What is Tableau?
Tableau is a visualization or Business Intelligence tool, transforms the way we use data to solve problems empowering people and organizations to make the most of their data. It comes with features that allow users to drill down data and see the impact in a visual format that can be easily understood by any individual. Tableau also comes with real-time data analytics capacity and cloud support. We will read more in-depth in this Tableau Tutorial.
Benefits of Tableau Desktop
1. Insightful visualizations
Tableau connects to many different data sources and can visualize larger data sets. In Tableau, you select the data and switch between visualizations on the fly. It’s easier to jump between visualizations in Tableau.
Tableau visualizes data from the start, allowing you to see the significance right away. Tableau differentiates linking using size, color, labels, and shapes, giving you context as you drill down and explore on a granular level.
2. Depth of discovery
Its features give users ways to answer questions as they investigate data visualizations. The outcome results can tell basic trends as predictions, use “what if” queries to adjust data hypothetically, and visualize components of data dynamically for comparisons.
3. Implementation
Tableau provides a variety of implementation and consulting services. For enterprise-level deployment, there’s a four-step process spanning weeks, and for smaller-scale deployments, there are quick-start options that can complete setup in a matter of hours.
Tableau provides a variety of implementation and consulting services. There are four phases for Enterprise-level deployment as mentioned below:
- The first phase involves IT planning, architecture consulting, pre-install checkup, server installation, and verification, and validation of security configuration.
- Phase 2 involves working with data and data migration, including data modeling, data mining, data extraction, data sources, and business workflow.
- In Phase 3, there’s a two-day classroom training covering Tableau Fundamentals, hands-on advanced coaching, and building and formatting visualizations.
- The last phase helps companies expand Tableau usage across their business or functions. It includes implementation workshops where topics such as evaluating action plans and defining measurable outcomes are discussed.
4. Automation functionality
Tableau is a little more intuitive in making processes and calculations. For example, once you created a calculation in a tabular format, the formula can be typed once, stored as a field, and applied to all rows referencing that source. This makes it easier to create and apply recurring processes. Tableau’s flexibility also allows users to create custom formulas that aren’t available in most of the tools.
5. Data source connectors
It offers hundreds of native connectors to easily pull, cleanse and correlate data from practically any source without having to create custom code.
Tableau Products
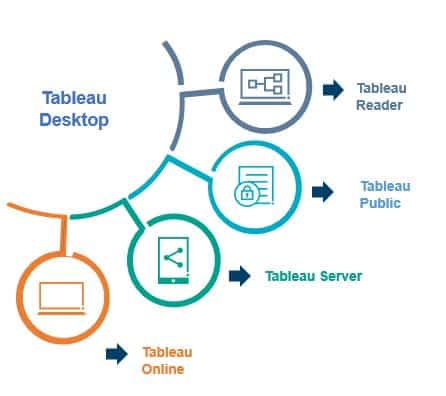
Tableau Desktop
It is self-service business analytics and data visualization that anyone can use. It translates pictures of data into optimized queries. With tableau desktop, you can directly connect to data from your data warehouse for life up to date data analysis. You can also perform queries without writing a single line of code. Import all your data into Tableau’s data engine from multiple sources & integrate altogether by combining multiple views in an interactive dashboard.
Tableau Server
It is more of enterprise-level Tableau software. You can publish dashboards with a Desktop version and share them throughout the organization with a web-based Tableau server. It leverages fast databases through live connections.
Tableau Online
This is a hosted version of the Tableau server which helps makes business intelligence faster and easier than before. You can publish Tableau dashboards with the Desktop version and share them with colleagues.
Tableau Reader
t’s a free desktop application that enables you to open and view visualizations that are built-in desktop versions. You can filter, drill down data but you cannot edit or perform any kind of interaction.
Tableau Public
It is free software that users can use to make dashboards but you need to save your workbook or worksheets in the Tableau Server which can be viewed by anyone.
Tableau Pricing
Tableau offers three kinds of subscription offerings to tailor the user needs. The subscriptions are as follows Creator, Explorer, and Viewer. All the prices are listed as user per month. But the bill charges annually. Let’s explore the subscriptions one by one.
The creator plan costs the user $70 per user per month. You need to pay the same amount for the on-premise or cloud platform. The Explore plan costs the user $35 for on-premises and $42 for cloud deployment.
Tableau Viewer should have at least 100 viewers in order to eligible to purchase the plan. Users can also get the 14 days free trial from Tableau. In this way, you can test it before you buy it. It also offers the user $500 per year packages for the more in-depth level of usage with no data limit restrictions.
Advantages of using Tableau over Power BI
Tableau is the best data visualization tool currently in the market. It provides a variety of visuals to make data more understandable for the users. It also allows users to consider a number of data points for conducting analysis.
Whereas, Power BI is not as powerful as Tableau. But it is the best fit for small businesses or companies. Any small business can afford it, and it offers enough functionality for its operations.
Power BI is still not the most widely used business intelligence tool. Thus it does not allow you to connect your application with the Hadoop database. However, users can connect it with some of the less powerful and small in size databases like Salesforce and google analytics.
On the other hand, Tableau is the most widely used and influential business intelligence tool. You can connect it with the Hadoop database. It also can identify the resource automatically. You can connect it with an enormous database. I hope this Tableau Tutorial gives you a clear picture of the Tableau tool.